
Summary:
- Go for event streaming if your data manage operational processes and proactive behavior is required. It is specifically designed for real-time processing with high throughput.
- Increased throughput usually comes at increased cost, but such is offset by benefits in efficiency and growth potential.
- Increased complexity and environmental impact should be taken into account, so carefully assess the use case. However, fully managed services and the choice of providers make usage more and more convenient.
- Servitization of technology for data distribution and the fight for the dominant data platform continues. So far this competition benefits the customer.
What’s the origin story?
Until the late 2000s, most data storage and delivery solutions followed a fairly standardized format. SQL databases1 were the preferred choice to store and manipulate data across various IT applications. Their tabular structure enables an intuitive understanding of data models and query formulation. For lower query frequencies and throughput requirements, they are still the go-to solution for data management today.
However, since the 2010s new storage and delivery technology has emerged to overcome slow data distribution. Event streaming2 supports continuous processing of smaller, event-based data packets. Developed from research projects in universities and social media companies this technology spread widely once it became open source.
Nowadays, it can be found in the majority of near-real-time processes at large enterprises worldwide from e-commerce recommendations to controlling logistics operations. Household names are Apache Kafka, Spark, Flink and Storm. Each of them runs under the Apache Foundation’s open source license and has a unique capability spectrum for certain use cases. In addition to these frameworks, there are an even larger number of solutions from proprietary vendors. For now, we will focus on Apache Kafka, since it has a high profile and is widely used (in over 80% of Fortune 100 companies).
Why use event streaming?
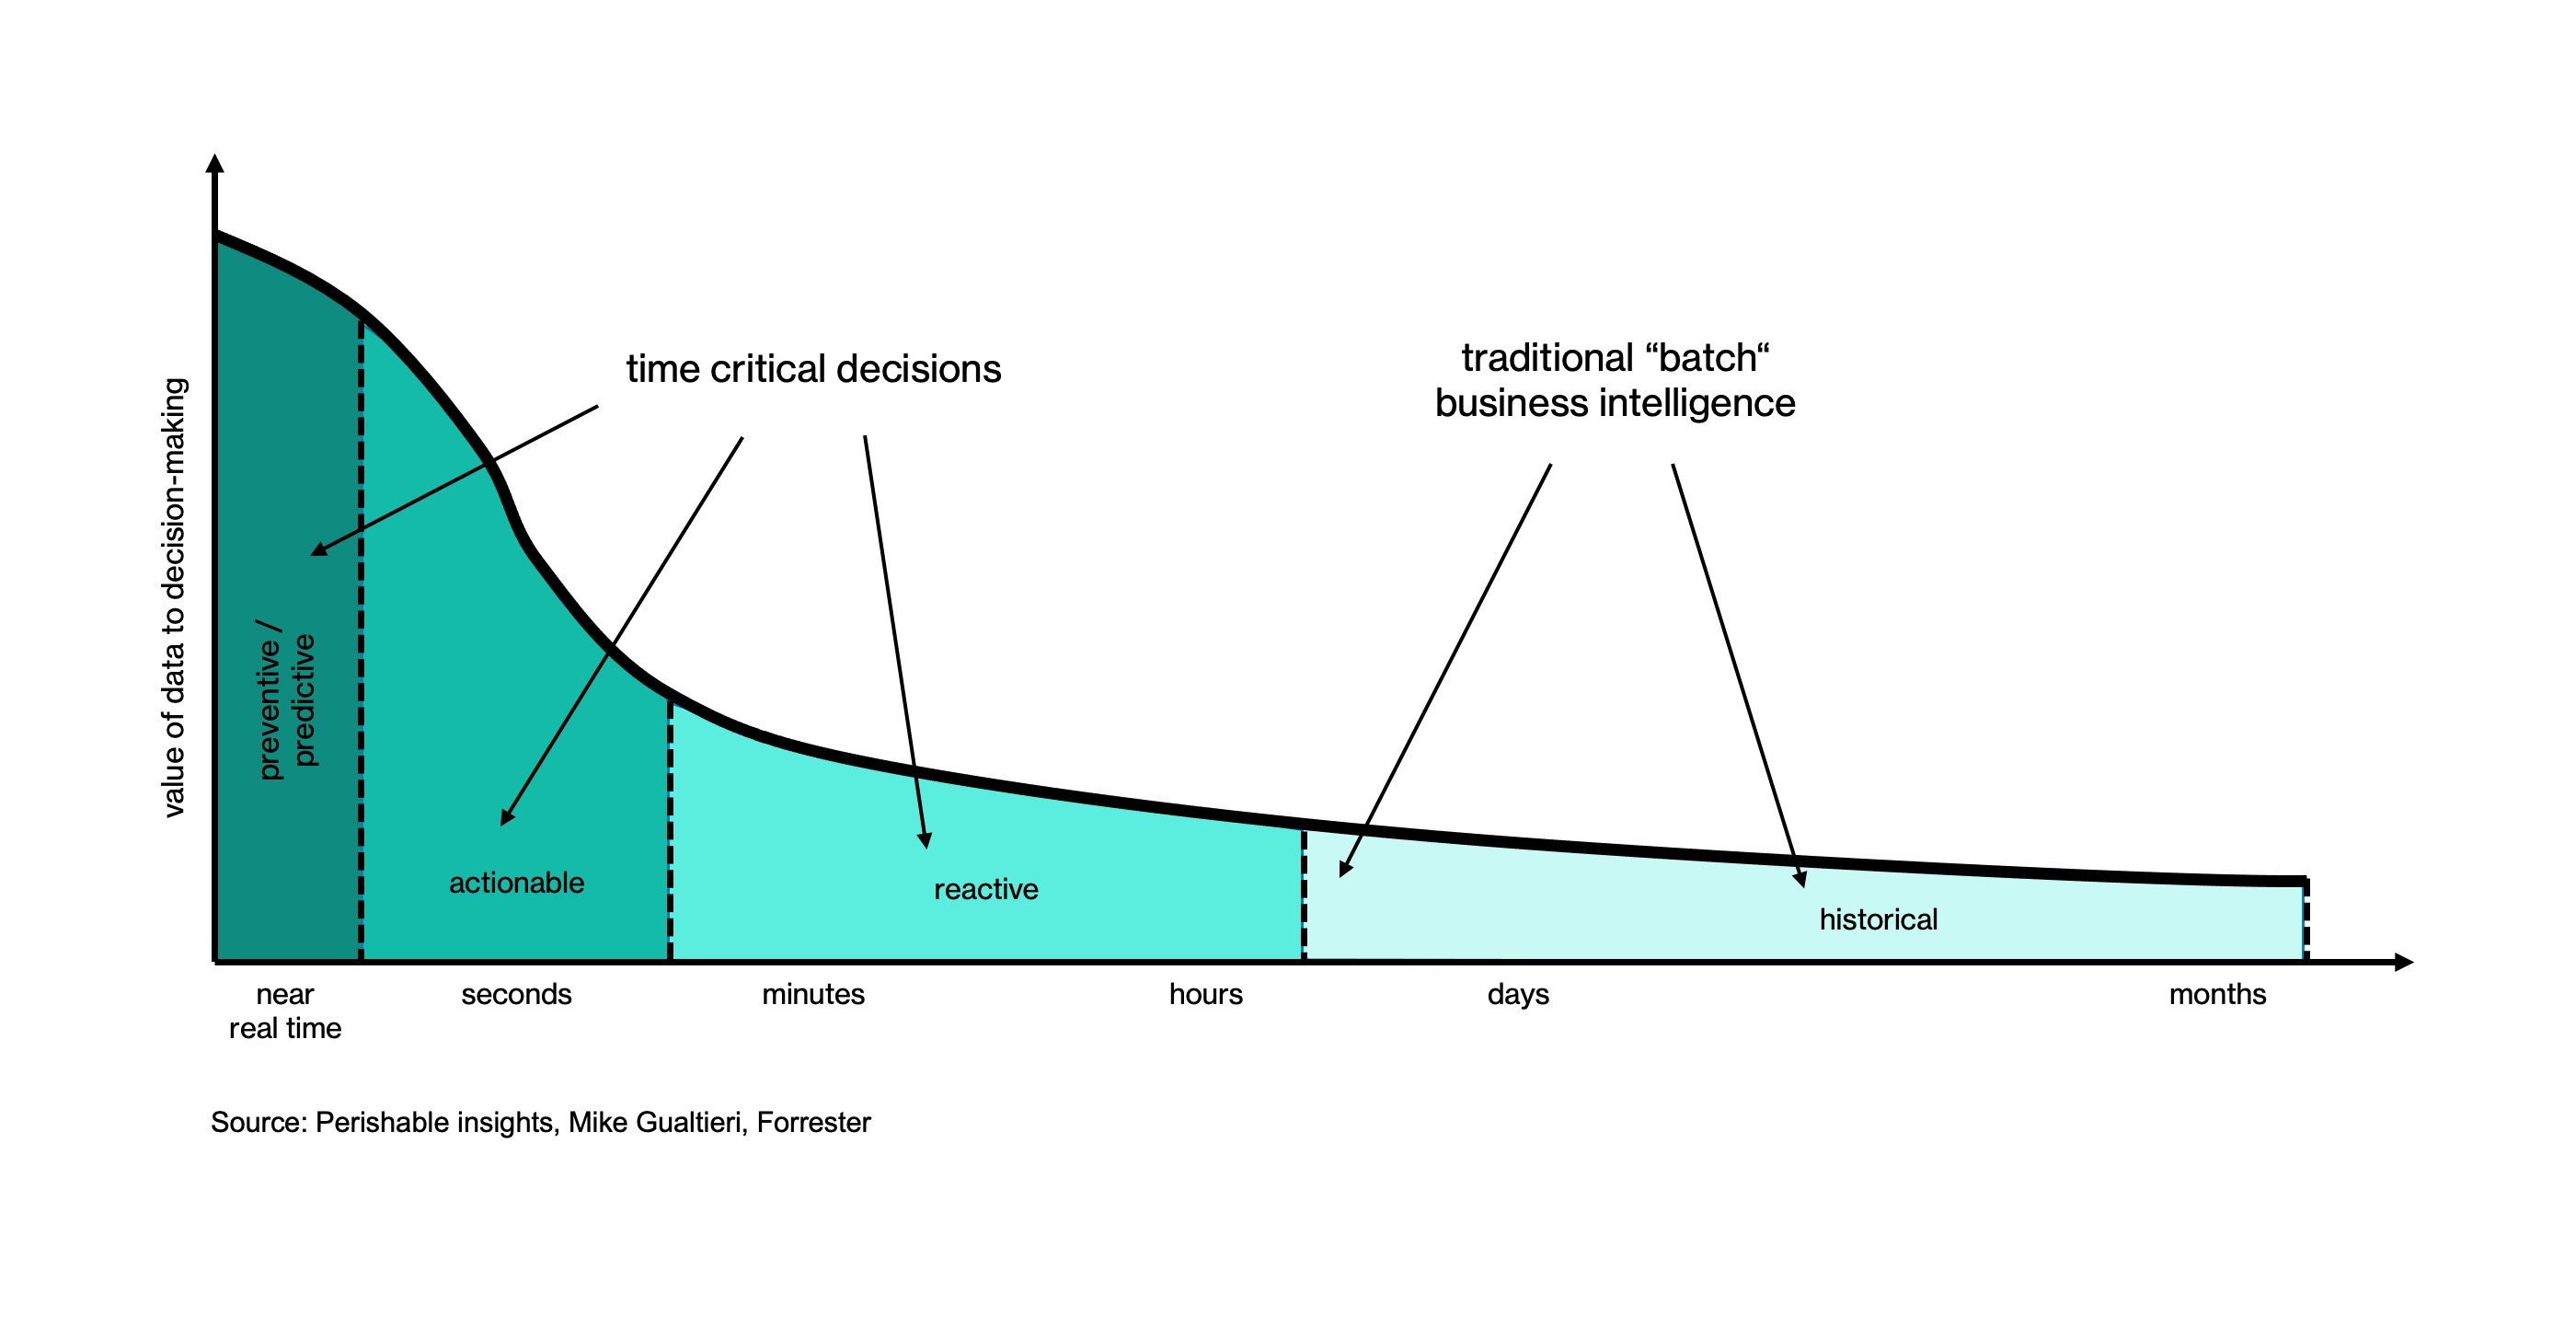
The main advantage of providing data almost instantly is the ability to act proactively, rather than just reactively, as events unfold. Operational decisions - whether on the internal or on the customer side - are made in short time windows that require an assessment of the context that is as up-to-date as possible. Data arriving in batches that cover long timespans might be useful for tactical and strategic purposes, but lose their criticality fast (featured image above). Imagine a competitive market with a fast moving product catalog. Many potential customers are lost to a company that updates all the ads in its online store at long intervals, instead of displaying each single update as soon as it is ready. The advantage of high operating performance is often offset by two disadvantages. Let’s look at the economically motivated first.
Does it pay for itself?
Higher (data) throughput usually increases operating costs due to higher maintenance and energy consumption. This needs to be set against the value won by a higher degree of operational efficiency. Depending on the use case, data processing and storage solutions differ greatly in their technological composition and scaling. This makes it difficult to find scientific publications on the economic comparison between batch and stream delivery without specifying the context.
I therefore resort to an exemplary calculation of my own. It is intended to provide an approach for an initial cost-benefit calculation of data delivery technologies. To avoid the difficulty of dealing with non-comparable deployment practices and product categories, the technical specifications focus on common infrastructure categories in the cloud. The major cloud providers have different specializations, but compete in the same price range when it comes to basic compute and storage provisioning. For simplicity, I assume that market prices include infrastructure management and energy consumption. The source for the upcoming numbers is the pricing calculator from Microsoft Azure. Azure is chosen as the exemplary cloud provider as it is suitable for practical exercises of the associated tutorial.
1) Calculating scenarios: batch vs. stream delivery
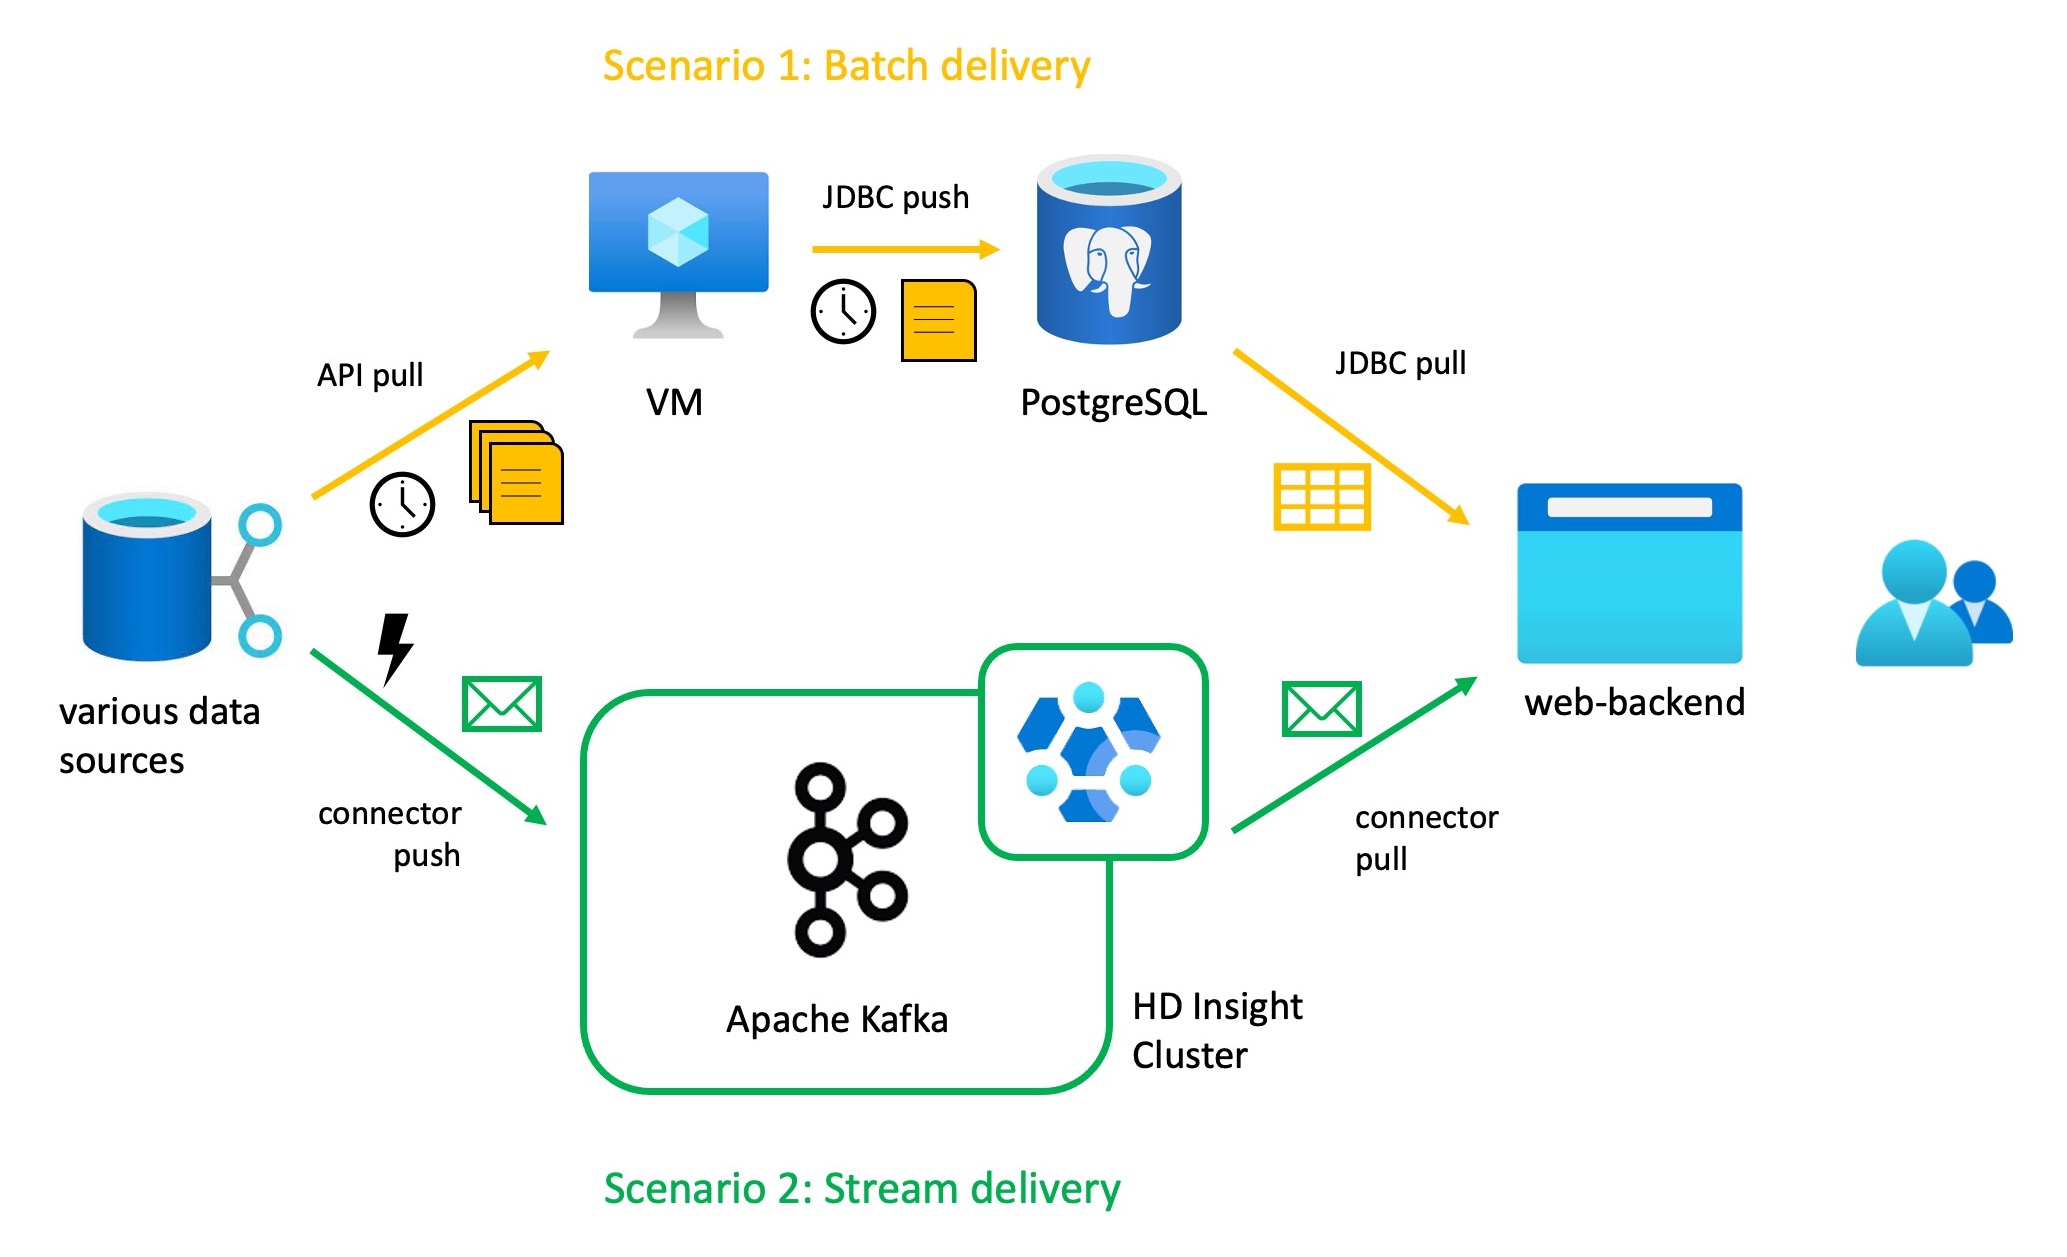
Lets go back to the use case of a company listing fast changing product and price updates online. By comparing two scenarios, one with a batch approach and one with a streaming approach, we can gain insights. The examples are deliberately kept simple for demonstration purposes. We first look into the technical assumptions and their current pricing (02.2023 West Europe region):
- Batch delivery setup:
- Azure Database for PostgreSQL is a general purpose SQL database with an open source licence. Answers to JDBC3 queries can be given quickly, but their timeliness depends on the data integration flows. A Single server (Gen 5, 8vCore, $0.8336/hour) with 1TB of storage ($0.137/GB) costs $757.33/month.
- A virtual machine (VM) acts as a staging area for new data on products/prices. CSV4 files are retrieved at regular intervals from various application programming interfaces (API). Scheduled scripts are used to summarize the data and write it to the database. A small Linux VM (A3: 4 Cores, 7GB RAM, 285GB temporary storage, $0.240/hour) costs $175.20/month.
- Stream delivery setup:
- Apache Kafka works as a near real-time data delivery system. New information about products/prices is continuously written into a Kafka topic by producers and consumed as needed (more explanation: tutorial). Kafka, which runs in the Azure Service HDInsight in its most basic configuration (Instances: A6 for Head and Worker node, A5 for Zookeeper node, D4 for Edge node, Standard 1024GB Disk size), costs $1,662.21/month.
At first glance, we see that the streaming setup is about 1.8 times more expensive at $1,662.21/month than the monthly $932.53 for a batch delivery setup. How can this significant cost increase be justified for a small online business? Let’s assume realistic figures and calculate economic indicators. The context:
- On average, each sale of a product earns the business a profit of 5$. Bookmakers have already deducted the cost of procurement, wages, website, etc. from revenues, so the only cost to calculate is the cost of data delivery, which now makes a difference.
- The website is visited by around 500 potential customers per hour. In the current constellation of scenario 1), one out of 200 (0.5%) buys a product. The other customers leave the store because they can’t find the latest product they are looking for or because the competition advertised faster.
With these propabilites we can calculate the expected values, i.e. the expected profit for both scenarios.
- Scenario:
- New data is always collected in the VM for an hour until the scripts start and the database is updated. On an hourly basis the setup costs around: \(\frac{$932\ /month}{730\ hours/month} = $1.2\ /hour\).
- The expected profit from each website visit (on average) is: \($5\ /purchase * 0.005\ purchases/visit = $0.025\ /visit\)
The expected hourly profit is therefore: \(500\ visits/hour * $0.025\ /visit = $12.5\ /hour\) - The remaining hourly profit is: \($12.5\ /hour - $1.2\ /hour = $11.3\ /hour\)
- Scenario:
- The Kafka instance provides continous data updates to the store, which are on average 40 per hour. Each actualisation therefore costs around: \(\frac{$1.600,00\ /month}{(40\ act./hour\ *\ 730\ hours/month)} = $0.056\ /act.\)
But to make costs comparable to scenario 1) we calculate the hourly costs as: \(\frac{$1.600,00\ /month}{730\ hours/month} = $2.27\ /hour\) - Frequent product and price updates have elevated customer acquisition to every 150th (around 0.67%). This means that the expected profit is now around: \($5\ /purchase * 0.0067\ purchase/visit = $0.033\ /visit\)
The expected hourly profit therefore rises to: \(500\ visits/hour * $0.033\ /visit = $16.5\ /hour\) - The remaining hourly profit is: \($16.5\ /hour - $2.3\ /hour = $14.2\ /hour\)
- The Kafka instance provides continous data updates to the store, which are on average 40 per hour. Each actualisation therefore costs around: \(\frac{$1.600,00\ /month}{(40\ act./hour\ *\ 730\ hours/month)} = $0.056\ /act.\)
Using these figures, we can see how an increase in the cost of data delivery is justified by an increase in overall profit. If we set $11.3/hour as the outcome for scenario 2), we can calculate the minimum increase in customer acquisition required to reach the break-even point for an event streaming transition. The result of the calculation postulates: If the probability of a purchase by event streaming changes to 1:184 (from 0.5% to 0.54%), the hourly profit is already the same as in scenario 1).
2) Assessing streaming potential: volatility and urgency
The potential impact of this technology on customer satisfaction becomes clearer when we look at the actualization costs of scenario 2). At first glance, $0.056/act. appears uneconomical compared to an expected profit of $0.033/visit. However, the expected profit is an average value for all product categories and points in time. We have already found that the customer base is quite volatile, as interest quickly wanes if expectations are not urgently met. If every single one of the 40 product/price updates per hour is a potential reason for customer acquisition, the picture is different. Now $0.056/act. is the cost we pay for a high chance of 1:n additional $5 profit. Imagine 25% of all potential customers are looking for an updated product/price that is included in the 40 updates provided in near real-time.
The expected profit would rise to: \($5\ /purchase * 0.25\ purchase/visit = $1.25\ /visit\)
And the expected hourly profit would increase to: \(500\ visits/hour * $1.25\ /visit = $625\ /hour\)
These growth figures are considerable and we even examined a fairly underutilized scenario, while Kafka can usually handle a large number of messages per second. This shows the enourmous potential of event streaming technologies in use cases with high volatility and urgency. Such is not surprising for scenarios in which rapid adjustments to environmental influences or customer requirements are essential.
Please note that I do not discuss more extensive infrastructure requirements at this point. The transition to event streaming typically requires extensive deployment or modernization of data sources and appropriate network infrastructure. These long-term investments are strategic in nature and beyond the scope of this showcase.
Is it complicated?
Now we come to the second potential drawback of event streaming, namely the increase in technical complexity. Compared to relational databases, these new concepts and tools do not only require a rethinking on how data is processed and stored. They require trained personnel to manage a more complicated and maintenance-intensive infrastructure. This makes adoption difficult, especially for smaller companies that don’t have the resources for these in-demand streaming engineers.
But as with many complicated solutions in IT, after some time there are software and service solutions that make the technology more user-friendly. Earlier we looked at HD Insight as a deployment option for Apache Kafka in Azure. Since this still requires you to work with core Kafka, it still falls into the “more difficult” category. Increased ease of use is offered by fully managed Kafka services from the cloud providers themselves or from independent vendors. Aiven, Amazon MSK, Red Hat OpenShift and Confluent Cloud are popular examples. Once you understand the basic features of Kafka, you can work with these solutions without having to worry about maintaining the infrastructure yourself.
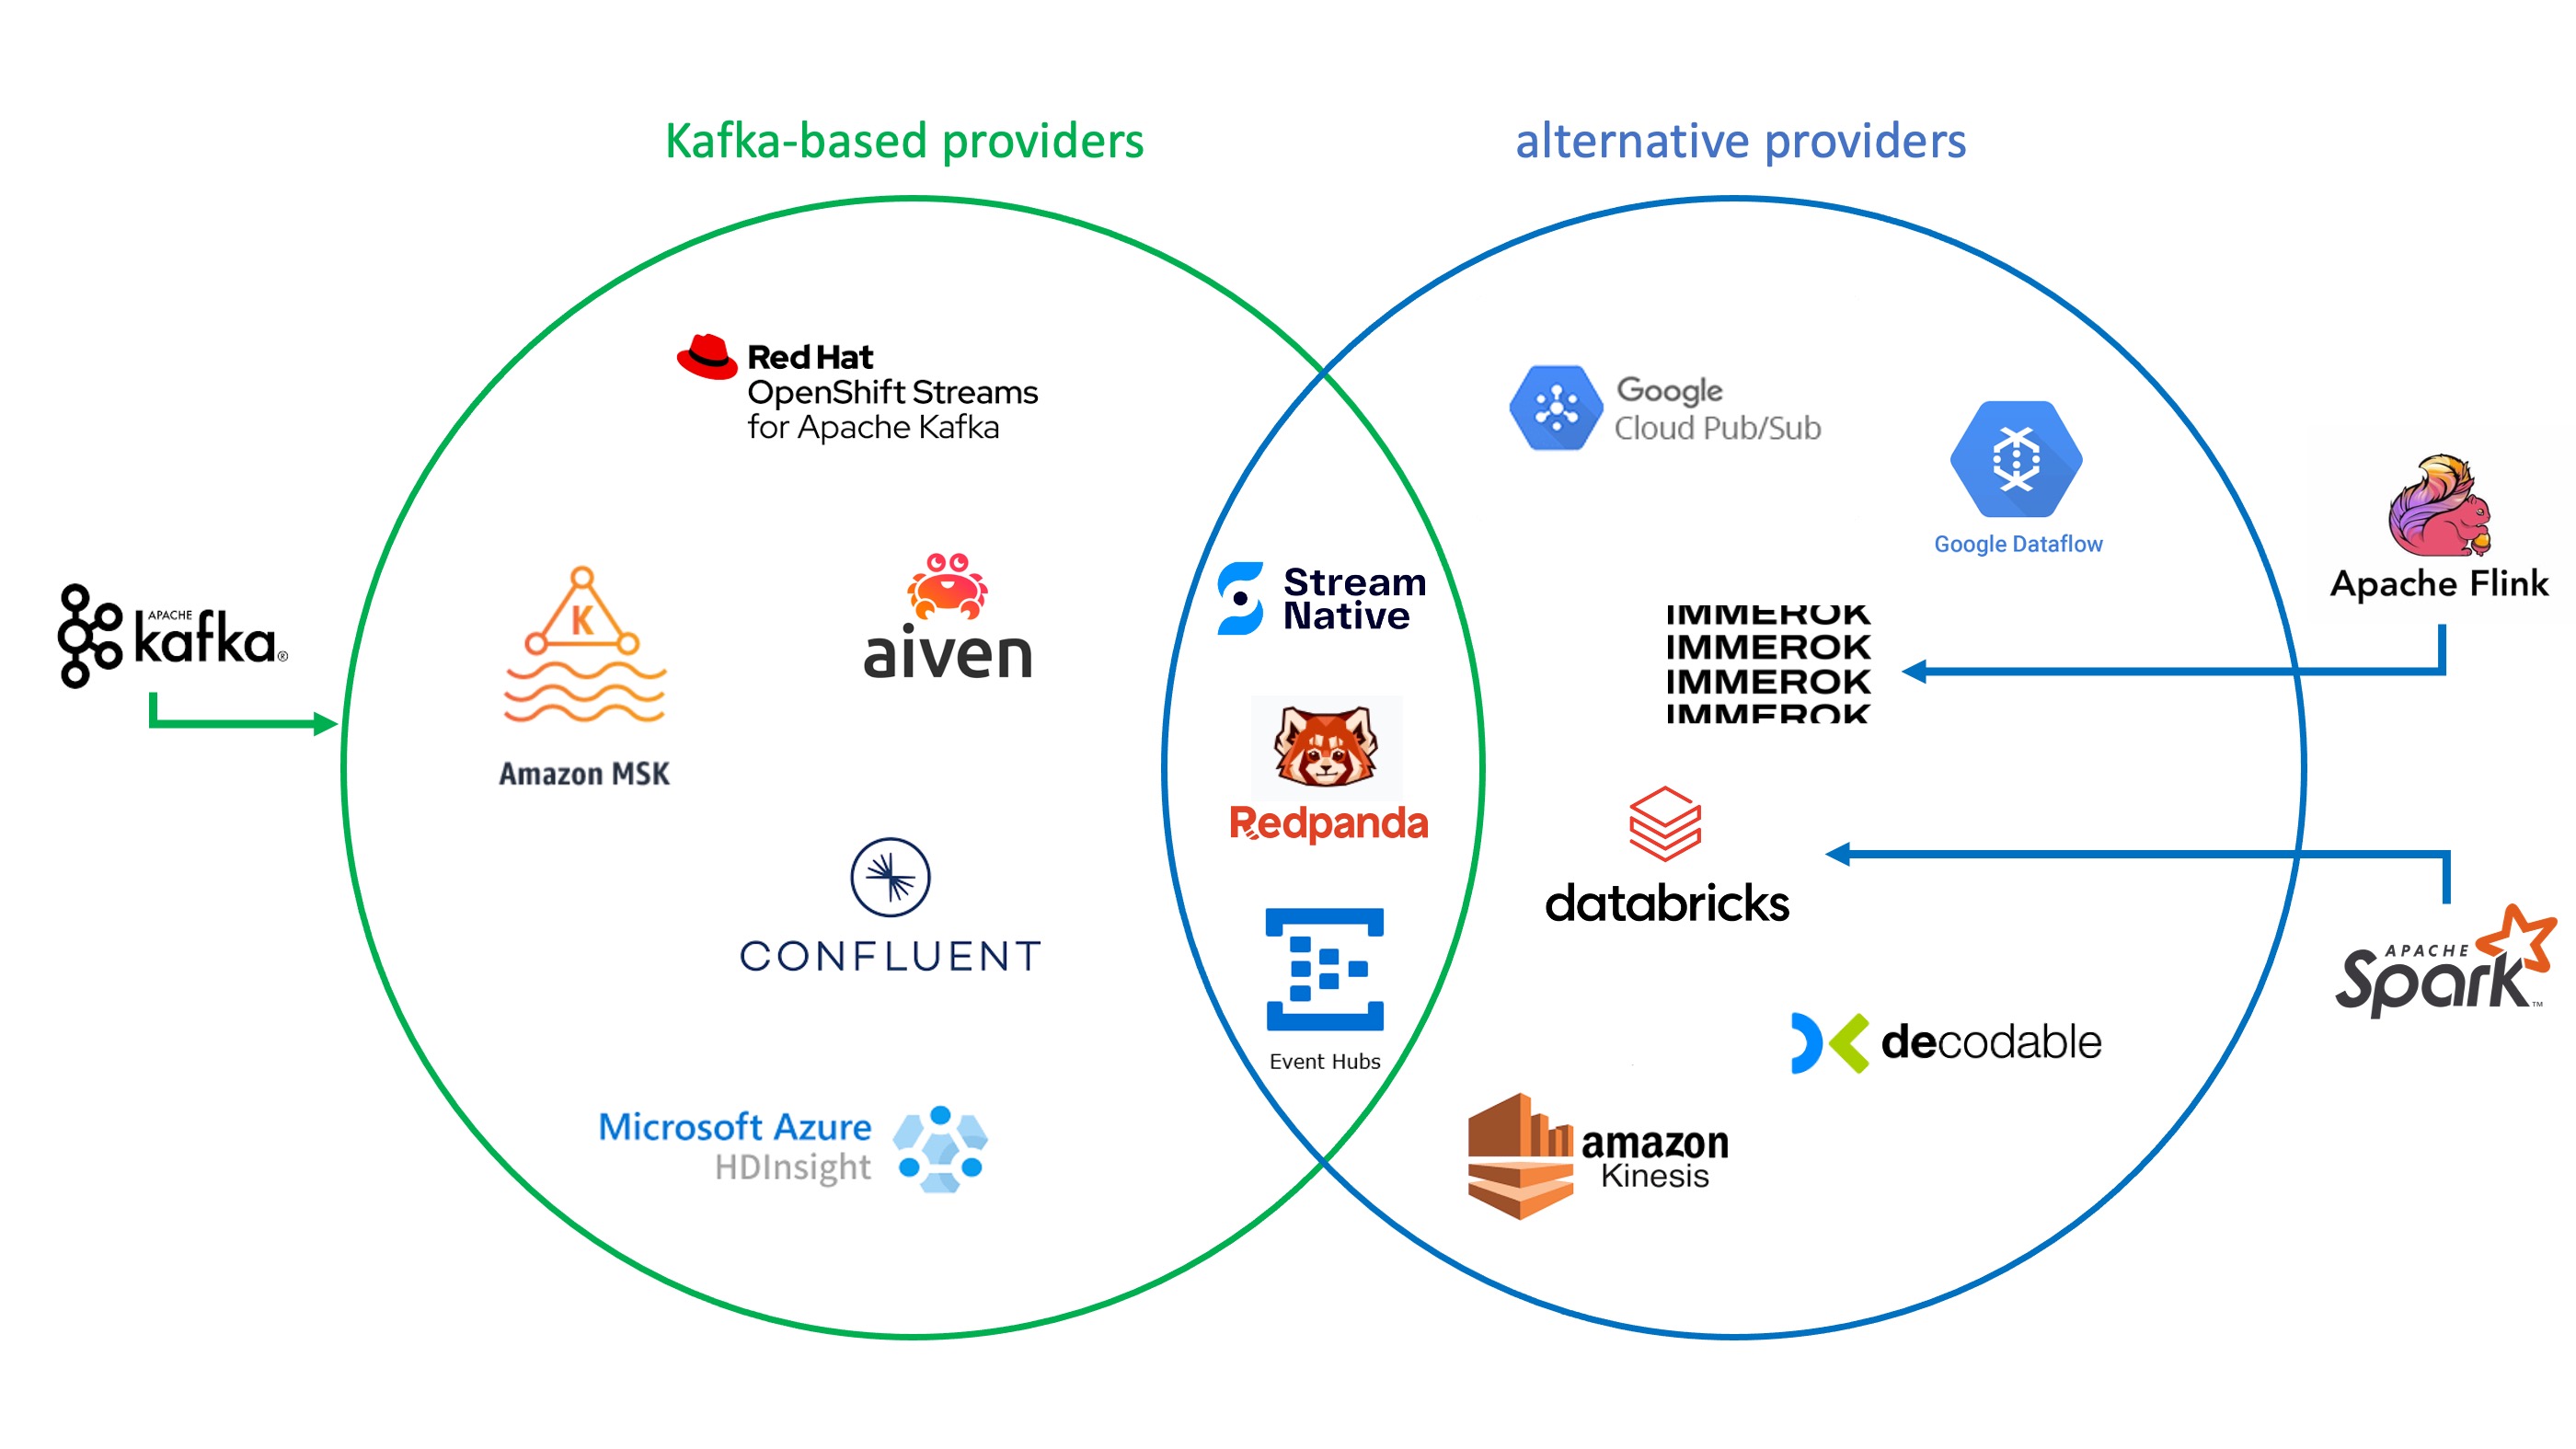
As stated in the introduction, Kafka is not the only event streaming framework. Apache Flink and Spark have their own raison d’être, for example, when it comes to supporting data analytics and machine learning tasks. These two can also be found in managed services like Databricks and Immerok. And this selection is only part of the range of other non-Kafka or only partially Kafka-based streaming solutions (see figure above). It’s difficult to compare these offerings without falling into a bias. Gartner Inc. is an established source for impartial reviews. Although there is no recent report on event streaming, you can find a useful ranking of user reviews here. Filter options help narrow down the selection by company size, industry and region. If you are interested in a deeper insight into the current landscape of data streaming, I can recommend the well-known blog by Kai Waehner.
What about its environmental impact?
Advancing digitization is consuming more and more electricity, most of which is not yet generated renewably. Event streaming technology, with its high throughput requirements, is no exception in this respect. But as with economic calculations, one can weigh the environmental costs against the positive impacts. These considerations are again highly dependent on the industry and use cases. Efficiency increases in emissions-intensive industries can often only be corrected by compensation programs. In contrast, companies with energy or material sustainability concepts can achieve direct positive effects through operational efficiency improvements.
This does not necessarily mean that more output or growth will be achieved by using streaming technology. Savings potential can be just as valuable. Examples include route optimization in logistics or the planning of production windows outside peak loads in the power grid. A similar approach to the example calculation in the previous sections could be used - but instead of looking at profit per unit, one would look at savings/cost reductions per unit.
In conclusion, it must be said that - as with all technologies - there is no one size fits all. SQL databases are still cost-effective storage solutions, and batch deliveries make sense in non-urgent scenarios. IT infrastructure investments are high risk and lead to technical debt. Careful calculation of business cases is still a must.
Where does the story go?
If you follow the trends in the market for data processing and storage solutions, you’ll recognize two companies that are currently driving change. Snowflake and Databricks are gaining market share by championing unique perspectives and ultimately sharing the same goal - to be “the one cloud platform” for all data-related processes: Integration, Storage, Analytics, Machine Learning (ML), etc. Snowflake is praised for its high-performance and easily scalable storage solutions. Databricks, on the other hand, is preferred by customers focused on data science and ML applications. For a good overview of the evolution of the competition between the two companies and their products, see Kostas Pardalis’s blog.
Although both platforms are versatile and have streaming technologies, I chose Confluent Cloud for the hands-on tutorial. The reason is that no other company currently packages event streaming the way Confluent does. Founded by lead inventors of Apache Kafka, the company focuses on developing fully managed solutions for real-time data delivery. Its recent acquisition of Immerok to add Apache Flink services to the mix underscores that goal. Snowflake and Databricks are integrating more and more features, but don’t have a head start in this regard. Right now, all three companies’ products are seen as complementary services in the marketplace. And they recognize this by offering connections between the features of their products, until perhaps they can convince you of their own solution.
These developments are crucial for the current architectural trend towards a highly networked data mesh approach. If this trend continues, future cloud applications will consist of a central provisioning system and many decentralized processing systems. Solutions such as Apache Kafka will likely take on the role of a “central nervous system” in this regard. I strongly recommend looking into the data mesh topic and will likely cover it in a future post (see announcement). I hope that after this preview you will be motivated to learn more about the inner workings of Kafka. For an introduction with practical instructions on how to create your first streaming dashboard with Confluent Cloud and Power-BI, see the new tutorial.
1 Structured Query Language - relational database language
2 Also known as stream processing (see wikipedia)
3 Java Database Connectivity - database interface
4 Comma-separated values - delimited text file format