
The following tutorial is intended to give you a lightweight and practical introduction to event streaming. Look forward to quick visual results when building a dashboard with real-time data. If you don’t need the short explanation of Apache Kafka’s components in Part 1, you can jump straight into the step-by-step guide of Part 2.
Our toolset
The post event streaming in context looks at pros and cons of choosing Kafka as a stream-processing platform. We can avoid the issue of technical complicacy by using Confluent Cloud in this tutorial. This way we can have a beginner-friendly Kafka experience.
Choosing Microsoft Azure as the cloud provider where we host our Confluent service has two advantages. First, we can use your existing Microsoft 365 account to easily create an azure account with free trial benefits. Second, no additional Confluent account setup is required as Azure manages identity and payment details in the background. Of course, Confluent also offers free trial bonuses. As does our dashboarding tool Power BI. More concretely we will use the cloud-native Power BI Service. This means that all you need for the tutorial is your browser - no software installation is required.
If you are already working with other cloud providers like AWS1 or Google Cloud, you can still follow the tutorial of part 1 from step 2) onwards. Confluent provides documentation on how to set up its service on your platform as well. Both Confluent Cloud and Power BI are widely used in many industries and businesses. So there is a high chance that you will have an option to further work with them in the future.
Part 1: Kafka Basics
Our main goal in event streaming is to deliver messages from one side to the other, at the moment the events occur. In between the producing and consuming side lies a storage and delivery system like Apache Kafka. Kafka’s most relevant components can be seen in the following figure.
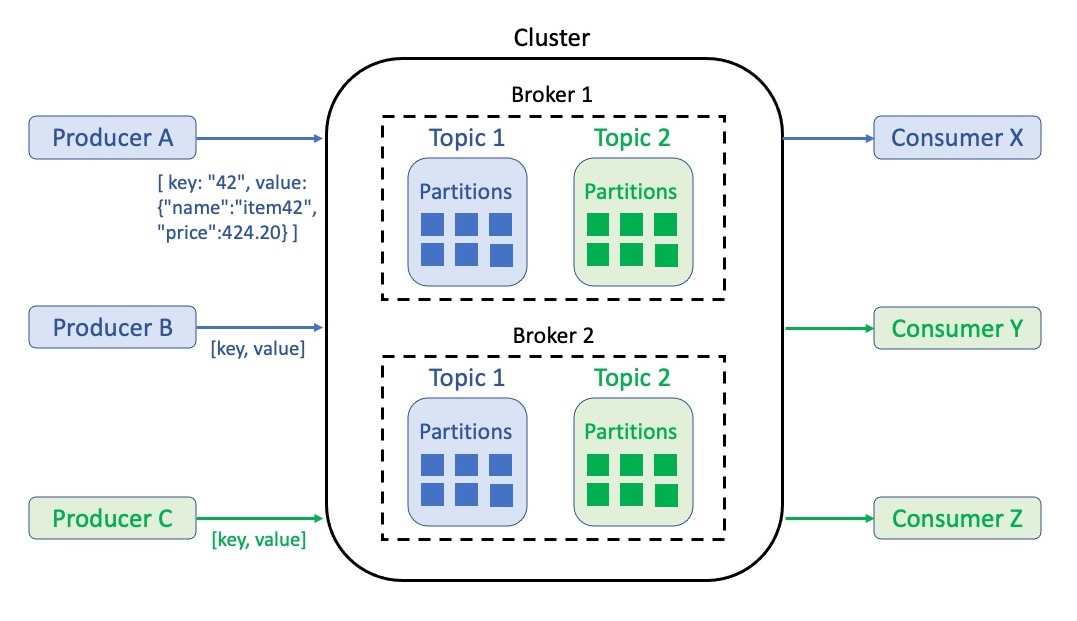
At the center, we see a cluster that houses other components as an infrastructure backbone. It is a compute and storage group that can be easily scaled to adapt Kafka to volatile throughput. From the inside out, we find the following within a cluster:
- Messages: Key, value pairs that describe an event like a notification or a state. A value contains information in a structured form (serialized object, for ex. in JSON2). Keys do not have to be unique identifiers. However, they pre-define in which order messages are stored and later processed. For example, updates on the price of a product should have a unique product id as a key to make sure that they are consumed in order.
- Topics: Thematic structures to group events - for example, one topic for product updates and one for customer updates. A topic stores events in immutable logs that are not accessible by index, but by offset. The retention period for data within these logs can be set as wished.
- Partitions: Break topics into smaller entities to increase processing performance through distribution among multiple compute instances. If messages have the same key they will always land in the same partition. Otherwise, messages are written into partitions via the round robin method.
- Brokers: A network of independent machines (can be computers, containers, servers, etc.). They manage partitions as well as read and write requests. Partitions are replicated and distributed among brokers to ensure security and redundancy.
Data transfer to and from the cluster is performed by two roles:
- Producer: Utilizes a Kafka-specific application programming interface (API) to write messages to one or more topics. The java-based API has many adjustable settings for the write service itself (client, network buffering, connection pooling, etc.). The written messages are also referred to as the producer record.
- Consumer: Reads messages by utilizing another type of Kafka API. The connection follows a subscription principle to pull messages from one or more topics. Such messages are called consumer records.
Connected systems can be producers and consumers at the same time. Keep in mind that a whole network of systems can use Kafka to exchange data back and forth. Many connected services also do not work with event-based data the way Kafka does or require a different communication protocol. For such cases, so-called connectors are used to wrap translation functionalities around the APIs. With a big and ever-growing ecosystem of (cloud) technologies and services, platform providers like Confluent offer marketplaces for pluggable connectors. This means that there is no hindrance when wanting to exchange data with systems like SQL databases.
Before the practical part starts, I want to point you at some additional learning material. Confluent has a number of great videos ranging from beginner-friendly to advanced content. They alternate between technical explanation and hands-on practice. I purposely presented you with the minimum Kafka vocabulary needed for Part 2. Confluent’s high-quality courses offer more than enough material to go in depth.
Part 2: Realtime Dashboard with Cloud Services
To envision our goal of building a real-time dashboard, let’s follow the use-case scenario of the previous post. As owners of the online business, we continually get updates on price changes from our pricing backend. In addition to updating our online store with this data, we want to give warehouse logistics a head start for upcoming purchases by announcing items that will soon pique the interest of our customers. For this purpose, our dashboard needs to show the product-price pairs that have changed in the last 20 minutes or less.
With the following step-by-step instructions, you will build a small prototype. In addition to reading the task descriptions you can also play the videos I made to show tasks 2), 4) and 5) visually. Follow this YouTube link to watch one continuous video, or open the individual parts at the end of each step.
1) Azure Account and Confluent Cloud setup
We start by creating a free tier Microsoft Azure account in one of two ways:
- For Students: If you have access to a university or school email start a plan without credit card details here. You must first sign in with your (school/university) Microsoft 365 credentials and then identify yourself with a valid phone number. The free credit is $100 and popular Azure services can be tested without credit usage.
- Everyone Else: Perform the same procedure with the regular credentials here, where you will also need to provide your credit card details. The free credit is $200 (for 1 month) and popular Azure services can be tested without credit usage (for 12 months).
After signing up we arrive at the quickstart center of the Azure portal. Navigate to the menu in the top left corner and choose Create a resource. Now we can search the marketplace for Apache Kafka® on Confluent Cloud™ and follow the setup guide here. For the first trial month, $400 of credit is available for spending. This amount is more than sufficient for our upcoming scenario. Afterward, all ‘pay-as-you-go’ billings will be handled by your Azure account.
2) Kafka infrastructure (Scenario)
The setup guide should have already prompted us to enter Confluent Cloud via automated login. In the tutorial video we start the following tasks from the Azure Platform to ensure repeatability:
- Navigate to Confluent Cloud. Create a cluster on a basic plan.
- Create a topic for the messages we want to handle. Our scenario is focused on product data so you could name it
products. Skip the creation of a schema for now - I plan to include the Confluent schema registry in an upcoming post about API connectors (see series introduction). - Go to the connector marketplace and select the Datagen Source Connector. It will write dummy data into our
productstopic to simulate a producer. Generate a global access API key that will allow the connector to access your topic. Although we just do exemplary prototyping, it is always best to store the (downloaded) key securely. Choose theProductdata template and JSON format so that we get suitable and simple messages delivered to our topic. In the advanced options, increase the production interval to 5.000 ms to simulate an incoming event every 5 seconds. Create the datagen connector and wait a moment until it is provisioned. - Navigate back into our topic and view incoming messages in the respective tab. Note that we just receive increasing numbers as product names, prices, descriptions, etc. An upcoming post will introduce more diverse data sources (see [here]). Now pause the connector until we reactivate it once the consumer side is ready.
3) Power BI Service setup
Before we can set up an endpoint to receive data from Confluent Cloud - which is not a functionality of Power BI Desktop - we need to create a Power BI Service account. You find the free tier offering here. It lasts for 60 days and includes the basic features which are more than sufficient.
After selecting try Power BI for free we are prompted to enter an email address. If you have an existing student or workplace account for Microsoft 365, you can use it and usually no additional setup is required. The other option is to sign up with a private email that is not linked to a standard provider like Outlook, Gmail, or iCloud. This way you can get past the barrier for personal addresses. Emails linked to private domains (ex. john@johnssurename.com) can be created for a monthly fee at providers like Google (see Workspace-Domains).
4) Power BI API and dashboard (Scenario)
We now prepare Power BI as the receiver before sending data from Confluent Cloud in step 5). Once you are within Power BI Service navigate to your workspace. It is located at the bottom of the left navigation bar or under the recommendations of the Home page. From within the workspace, do the following:
- Create a new streaming dataset. Select the basic API source and name your dataset (ex.
product_updates). The values you need to enter refer to the JSON keys we find in each message soon delivered by Kafka. Make sure they are written correctly. You can check the JSON example created in the window below. Also, change the data type fromTexttoNumberforpriceandid. Finally, enable theHistorical Data Analysisslider, as we want to keep at least the last 20 minutes of data. - After creating the streaming dataset we see a push URL3 which we copy and store securely for usage in step 5). The URL contains a token that should only be known to the sender (Confluent) and receiver (Power BI) - it is not for sharing. Although the connection will be securely encrypted through HTTPS4, please keep in mind that data is sent over the public web and such entails residual risk (more information here).
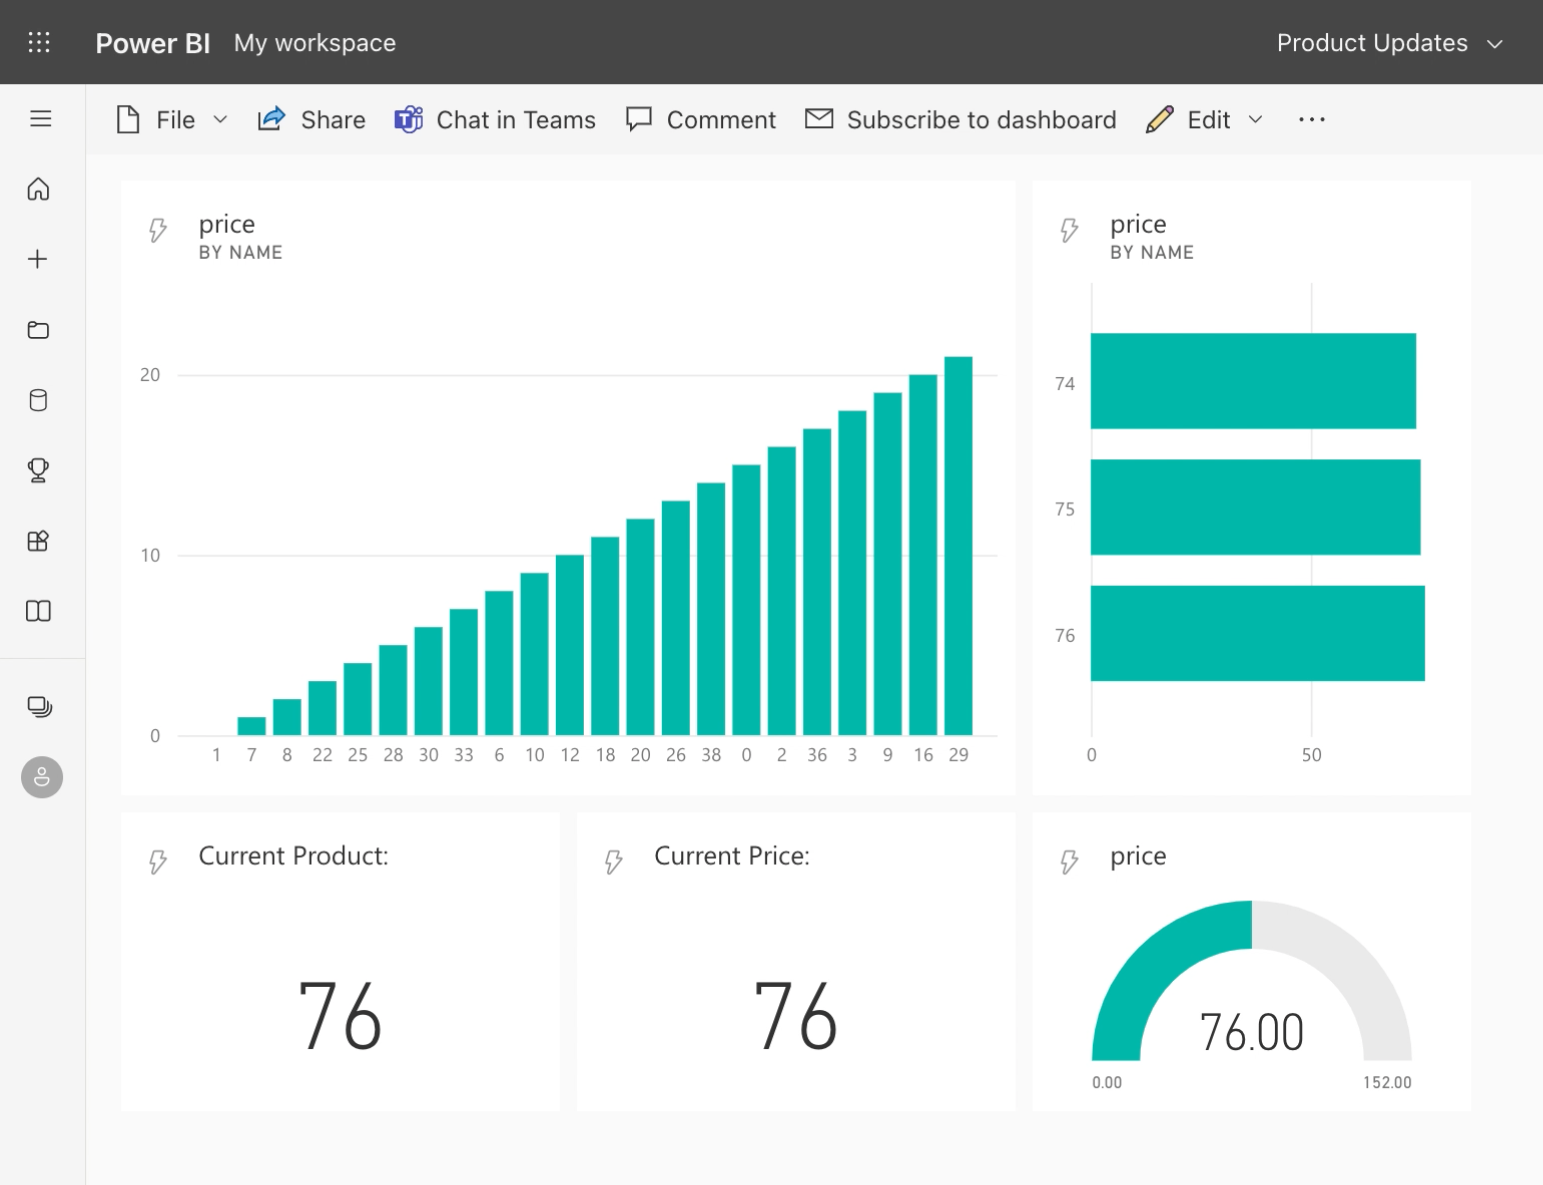
- Create a new dashboard and add a tile connected to your streaming dataset. For starters choose a clustered column chart as the visualization type. Enter
nameas the axis andpriceas values. Finish by choosing 20 minutes as the time window to display. You can optionally add more visualizations with smaller time windows, as shown in the video.
5) Confluent to Power BI connection
Data is now produced to our topic in Confluent, but we are still missing a consumer who can pull that data and push it to the Power BI API. Confluent has a fully managed connector for such purposes:
- Navigate back to the connector marketplace and select the HTTP Sink Connector. We follow the known procedure for the API key. Enter your URL from the Power BI endpoint,
TLSv1.25 asSSL Protocoland continue. Choose JSON as the record value format and open the advanced configurations. Here, selectjsonas the request body format andtruefor theBatch json as arrayfield. Create the Connector and wait for provisioning. - Now you can reactivate the Datagen connector to produce new messages again. We had to pause it before to prevent a large backlog of unconsumed messages from building up. The HTTP connector would otherwise try to catch up with an increased number of API requests and cross the limitations of the Power BI API (see restrictions). Error codes like 4296 are located within the messages of a topic named
error-...your_connector_name. Such topics are automatically created once sink connectors are provisioned and are meant to help you troubleshoot. - Let’s go back to the Power BI dashboard and look at the influx of incoming dummy values. Dashboards provide rapidly updating visuals for streaming purposes. However, they lack the comprehensive list of features that a classic Power BI report has to offer. The video tutorial shows how streaming datasets can also be used in a report - with the drawback of manual refreshments.
Congratulations on building your first real-time dashboard in the cloud. Our end result is a simple prototype with dummy data, but highly customizable and scalable thanks to the capabilities of Confluent/Kafka. In the next few posts, we will build on this and explore useful data integration and processing features. Stay tuned for updates over my LinkedIn profile or by bookmarking this website.
1 Amazon Web Service (AWS)
2 JavaScript Object Notation (JSON) - data exchange format
3 Uniform Resource Locator - address of resource in the web
4 Hypertext Transfer Protocol Secure - internet communication protocol
5 Transport Layer Security - cryptographic protocol. We use the supported 1.2 version as version 1.3 otherwise causes an error; see Confluent forum.
6 HTTP response status code 429: Too Many Requests. See error description in Power BI community forum.